• Contact
  • Homelab
Dimitris Tonias
  • Management
  • Monitoring
  • Cloud
  • Virtualization
  • Networking
  • Productivity
No Result
View All Result
  • Management
  • Monitoring
  • Cloud
  • Virtualization
  • Networking
  • Productivity
No Result
View All Result
Dimitris Tonias
No Result
View All Result

Zabbix server: More than 75% used in the configuration cache

Dimitris Tonias by Dimitris Tonias
March 5, 2022 - Updated on April 21, 2024
in Monitoring
Reading Time: 3 mins read
A A
3
Share on FacebookShare on Twitter

On every Zabbix server and proxy, there is a shared memory for storing host, item, and trigger data. As you add more hosts, items, and triggers to your server, you’ll eventually have to increase the size of this memory so that you won’t face any problems with your server’s performance.

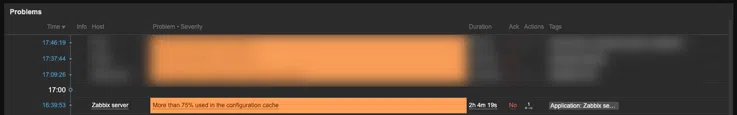
On my Zabbix server, I got the following alert (or problem): Zabbix server: More than 75% used in the configuration cache.

Zabbix server: More than 75% used in the configuration cache

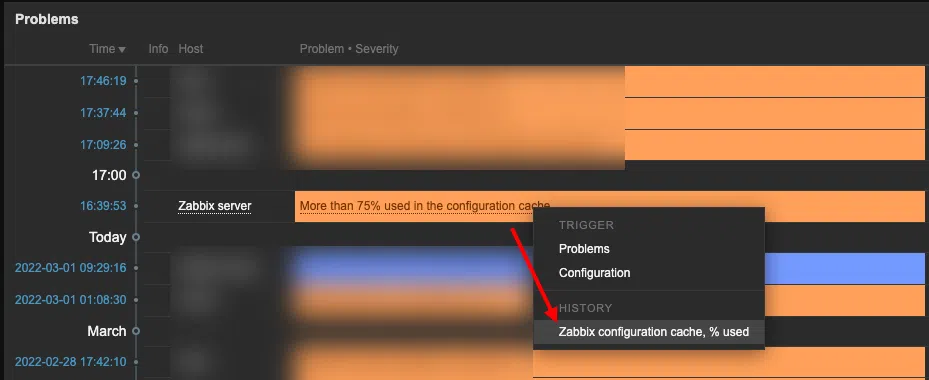
To get a more detailed graph, click on the problem and then click the Zabbix configuration cache, % used option.

Zabbix server: More than 75% used in the configuration cache

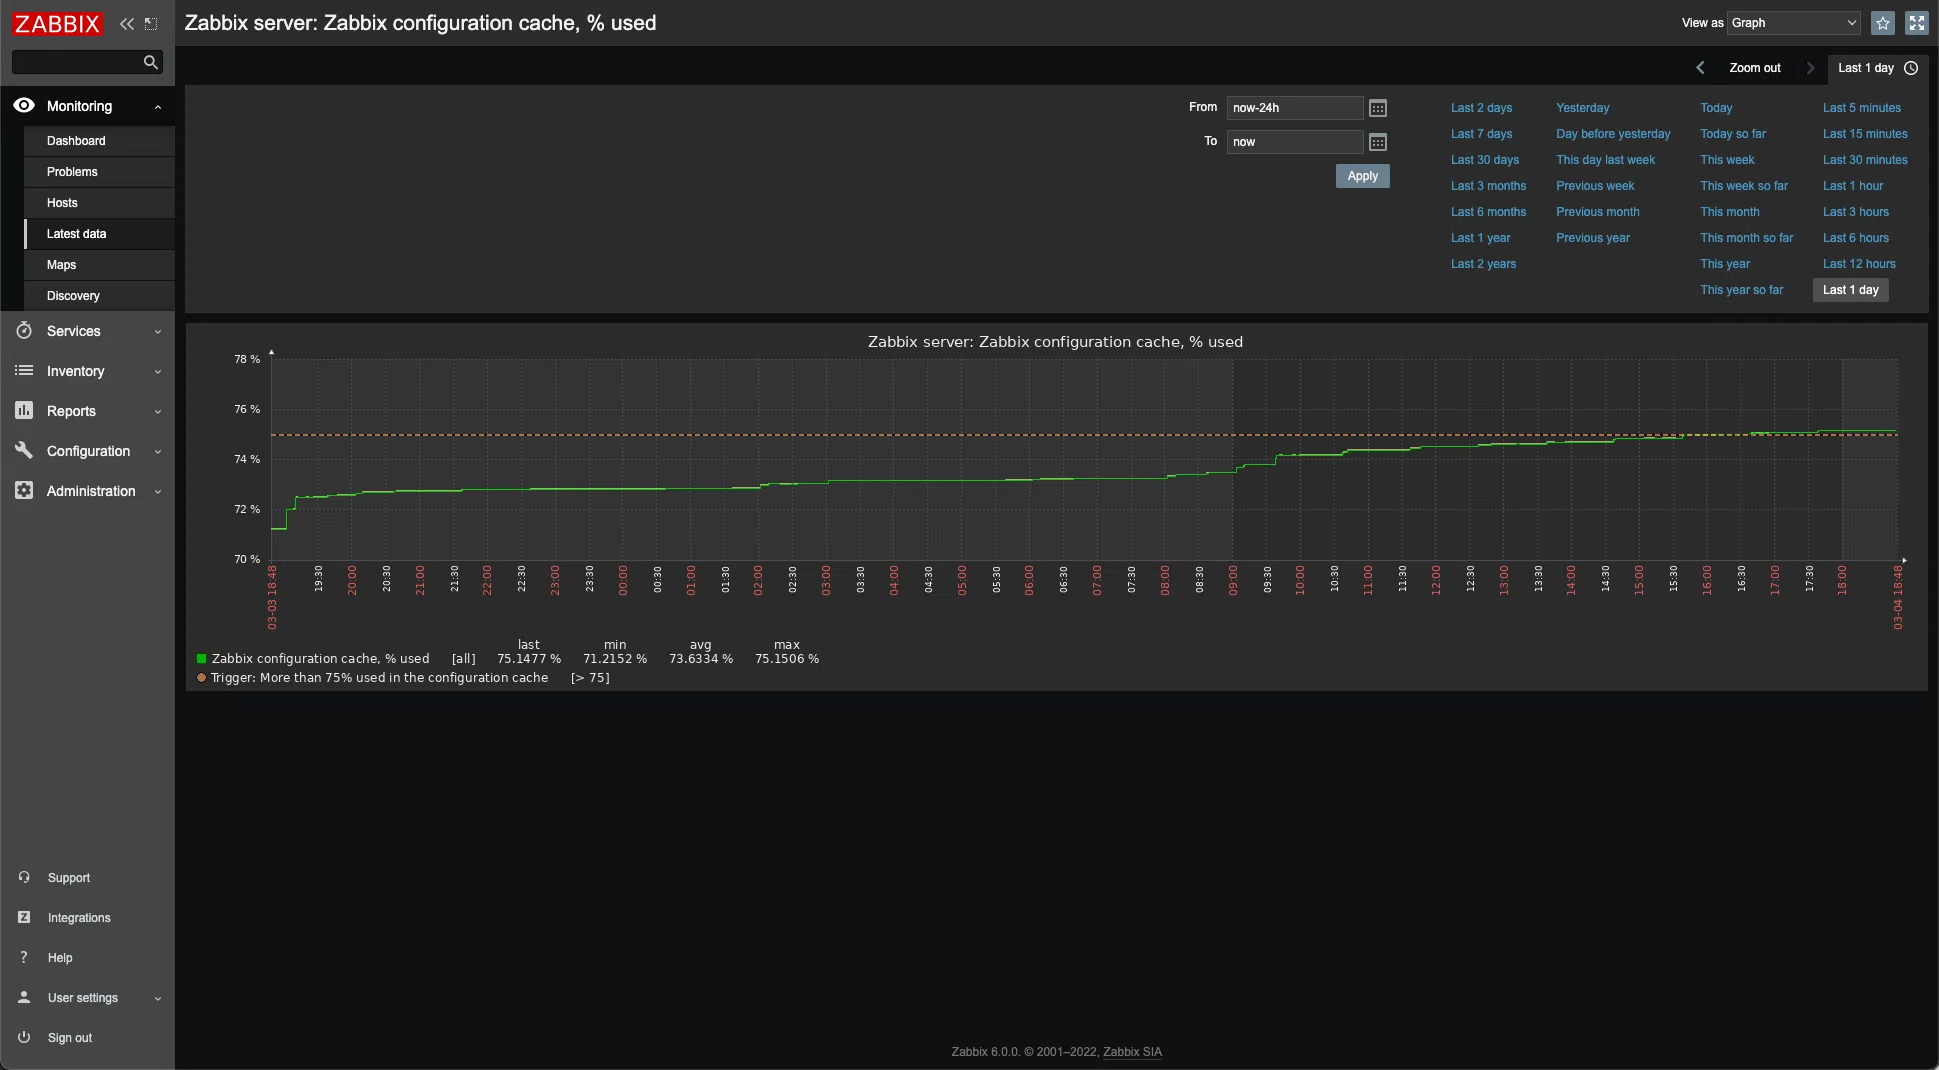
As you can see (based on the time range you select), there is a continuous increase over the last day. Once the Configuration cache usage has gone beyond 75%, the trigger was activated automatically.

Zabbix server: More than 75% used in the configuration cache

Don’t worry, this is a very common problem and we can fix it quite easily. What we have to do is edit the Zabbix server configuration file and change the CacheSize parameter.

How to fix high configuration cache usage on Zabbix server

You can find the configuration file in /etc/zabbix/zabbix_server.conf. Edit it with your favorite editor, I use Nano editor.

sudo nano /etc/zabbix/zabbix_server.conf

Find the CacheSize Option and change the parameter to something greater than the default value. Don’t forget to save the changes you just made. Note, the # sign indicates a comment on the file.

### Option: CacheSize
#       Size of configuration cache, in bytes.
#       Shared memory size for storing host, item and trigger data.
# Mandatory: no
# Range: 128K-64G
# Default:
CacheSize=256

For Zabbix 6.0+ the default CacheSize is 32M whereas in previous versions it was 8M. In my case, I changed it to 256M. The value is the size of the configuration cache, in bytes. The range you can choose is between 128K-64G.

To apply the new CacheSize value, you have to restart the zabbix-server service.

sudo systemctl restart zabbix-server

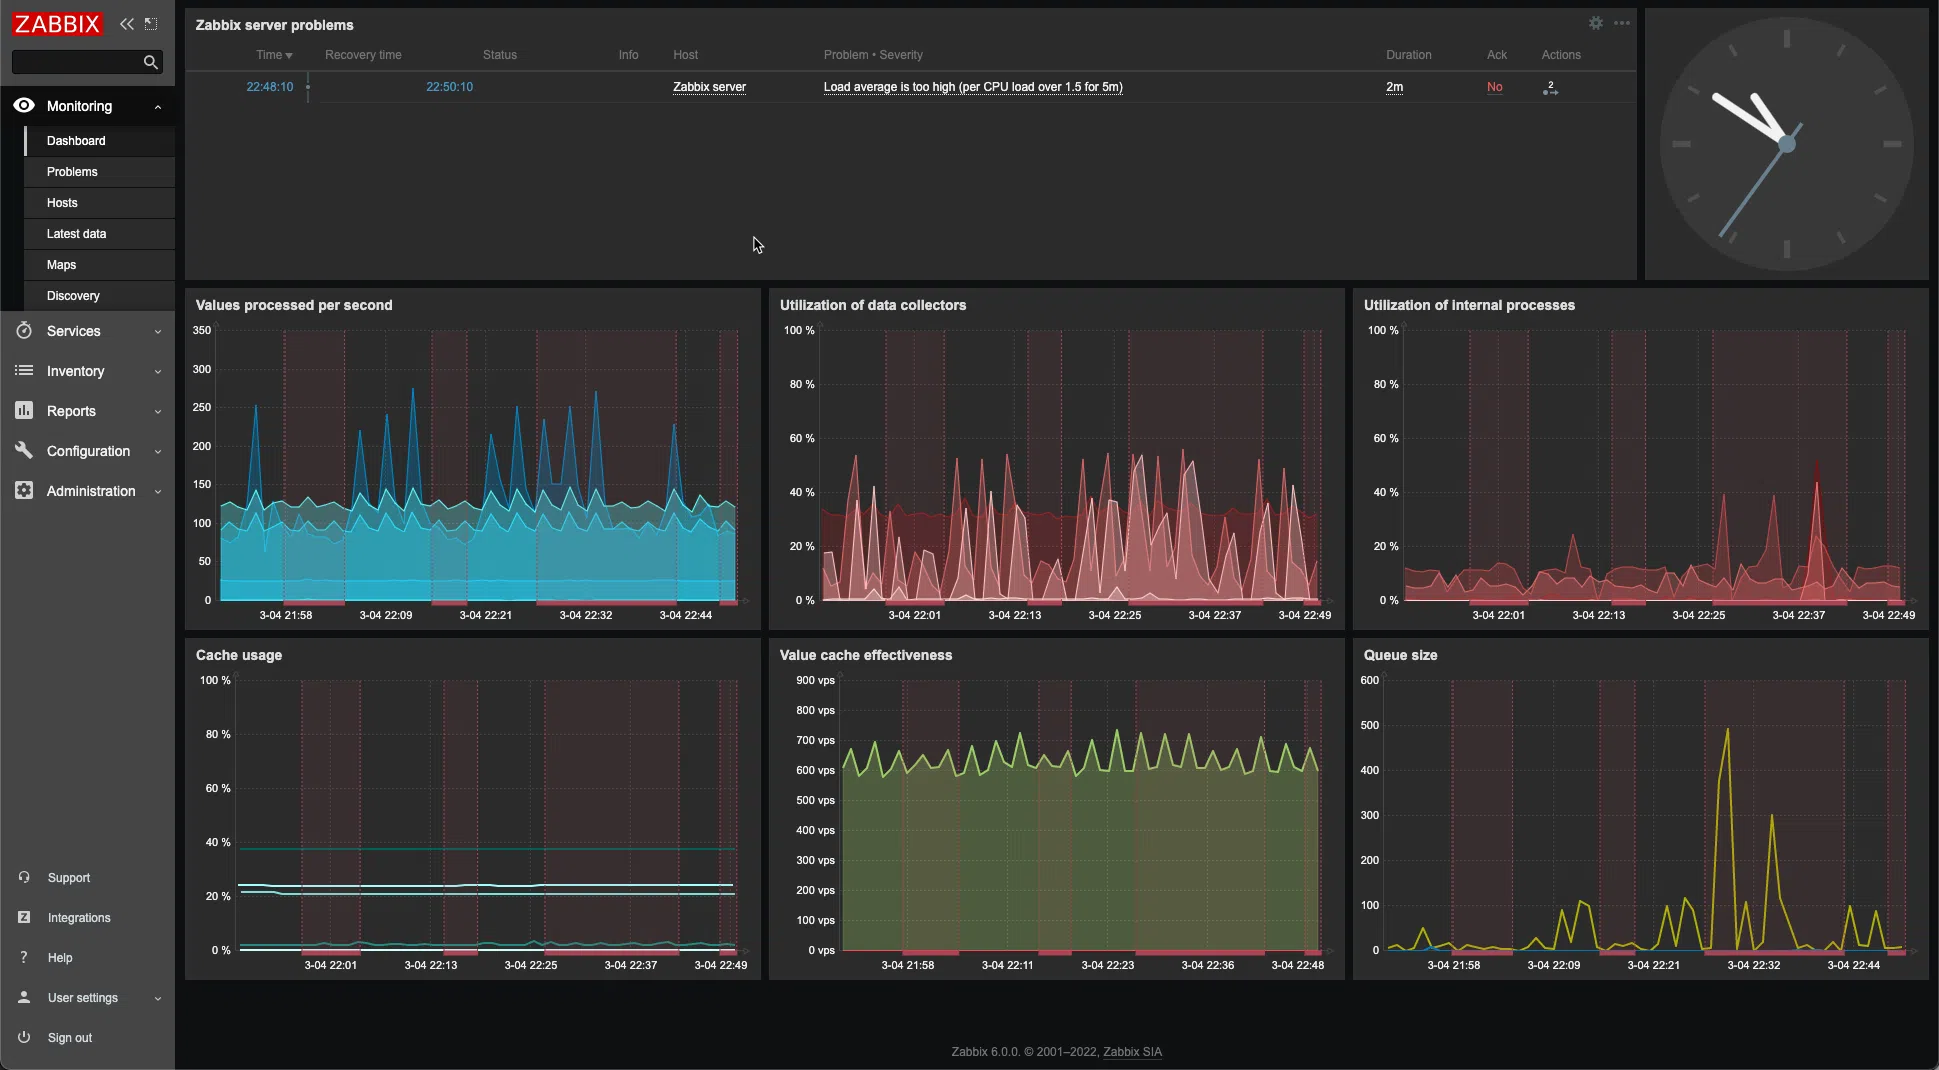
As you can see in the Zabbix Cache Usage graph, the problem is now resolved.

Zabbix server: More than 75% used in the configuration cache

As a side note, you can view the graph of all your Zabbix server Cache Usage in the Zabbix Server Health Dashboard.

Zabbix server: More than 75% used in the configuration cache
Tags: Zabbix
ShareTweetPin
Previous Post

Approve updates in WSUS 2016

Next Post

Check word count on Google Docs

Related Posts

Zabbix server: More than 75% used in the trends cache
Monitoring

Zabbix server: More than 75% used in the trends cache

Comments 3

  1. Liam Vineyard says:
    3 years ago

    Hi, I have the CACHESIZE from default to now 4G. It was moving by a percent or two when I moved it from 16m to 32m but after that I jumped to 256m only for it to move .2%. From 256m I then went to 4G and it did not move down even slightly. Is there something else that could be linked to this issue or should I just keep increasing it until I get a result or until i hit the max of 64G

    Reply
  2. Martin says:
    2 years ago

    Hi, thanx for help!

    Reply
  3. Nibras says:
    11 months ago

    iam follow with the steps but they show me :

    root@ubntu-zabbix:~# sudo systemctl restart zabbix-server
    sudo: setrlimit(RLIMIT_CORE): Operation not permitted

    Reply

Leave a Reply Cancel reply

Your email address will not be published. Required fields are marked *

No Result
View All Result
Zabbix server: More than 75% used in the trends cache
Monitoring

Zabbix server: More than 75% used in the trends cache

In Zabbix, "trends" are a type of data storage representing aggregated historical data. Zabbix monitors and collects a vast amount...

Read moreDetails
Check word count on Google Docs

Check word count on Google Docs

Zabbix server: More than 75% used in the configuration cache

Zabbix server: More than 75% used in the configuration cache

Approve updates in WSUS 2016

Approve updates in WSUS 2016

Configure Group Policy to deploy updates using WSUS 2016

Configure Group Policy to deploy updates using WSUS 2016

Configure computer groups in WSUS 2016

Configure computer groups in WSUS 2016

The initial configuration of WSUS 2016

The initial configuration of WSUS 2016

Get more stuff

Subscribe to our mailing list and get interesting stuff and updates to your email inbox.

Thank you for subscribing.

Something went wrong.

we respect your privacy and take protecting it seriously

  • Contact
  • Homelab

© 2024 Dimitris Tonias

No Result
View All Result
  • About
  • Contact
  • Free Tools
  • Home
  • Homelab

© 2024 Dimitris Tonias

This website uses cookies. By continuing to use this website you are giving consent to cookies being used.